
- Видео 265
- Просмотров 3 610 330
Data with Decision
Нигерия
Добавлен 10 дек 2019
Greetings, I'm Ismaila Omeiza M., and I'm thrilled to have you here!
This channel is your gateway to the exciting world of data analytics, where we explore Power BI, Excel, SQL, and an array of tech tips. While we may not have covered everything yet, with you as our subscriber, we're determined to exceed your expectations.
Join us on this journey as we take you from beginner to advanced levels in Power BI, Microsoft Excel, and SQL. But that's not all; we'll also guide you through a hands-on project using real-life data, ensuring you become a proficient data analyst in no time!"
Talk To me or send Whatsapp message to +234 8106 0903 65 Business only
Kindly subscribe to our channel.
Power BI Dashboard for Healthcare Analytics: Full Tutorial | How to use Power BI Desktop
Transforming Healthcare Data into Insights | Power BI Dashboard Tutorial
In this video, I demonstrate how to create an insightful and detailed healthcare dashboard using Power BI. We’ll explore the financial performance and provider insights of a healthcare center with advanced data analytics techniques. Watch as I utilize Power Query, Power BI Desktop, DAX, and PowerPoint to craft custom backgrounds for a stunning dashboard presentation.
Download full dataset here: drive.google.com/file/d/1EtNAUvnmik4yBdFy1_mvFMm3mV83eExQ/view?usp=sharing
Join my Membership to have access to all my Full Dashboards PBIX
Access the full Dashboard PBIX here as well: www.udemy.com/course/unlocking-dax-secrets-el...
Просмотров: 10 882
Видео


Power BI Dashboard Insights | Chris Brown ft Davido 'Hmmm' Comment Analysis
Просмотров 3,1 тыс.14 дней назад
Explore the fascinating insights we uncovered from the comments on Chris Brown's latest hit, "Hmmm" featuring Davido! In this video, we dive deep into the RUclips comments section and analyze the data using Power BI. Download Resources here: drive.google.com/file/d/1MUCDX7zjYT4ce1cq4-ClnLJlSWipzKl0/view?usp=sharing Join my Membership to have access to all my Full Dashboards PBIX Access the full...

Power BI Dashboard Makeover | How to create a Clean and Interactive Power BI Dashboard / Report
Просмотров 1,2 тыс.21 день назад
Part-2. This Power BI Dashboard will show you how to transform a basic Power BI Report/Dashboard into an Advanced Power BI Dashboard/Report. Follow me to learn how to use DAX and custom background to bring your Power BI Dashboard to Live. Download the dataset here: drive.google.com/file/d/1x04BcpMp0oV9RQ6eO08Lv1es0OVLQekU/view?usp=sharing Watch part-one here: ruclips.net/video/Ht9xijZ1sPs/видео...

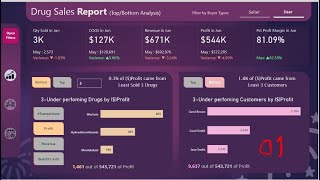
Be Creative with Power BI Dashboard | Creating a Drug Sales Dashboard Using Power BI Desktop
Просмотров 2,5 тыс.21 день назад
Part-4. Power BI Desktop Essentials: Designing a Dashboard for Drug Sales Analysis. If crafting dynamic and interactive reports and dashboards using Power BI Desktop is on your learning list, this RUclips video is tailor-made for you. Don't forget to subscribe for more dashboards. Thank you. Download Custom Map here: github.com/topojson/world-atlas?tab=readme-ov-file Watch part-2 here: ruclips....

Power BI Dashboard Makeover | How to create a Clean and Interactive Power BI Dashboard / Report
Просмотров 2,8 тыс.Месяц назад
Part-1. This Power BI Dashboard will show you how to transform a basic Power BI Report/Dashboard into an Advanced Power BI Dashboard/Report. Follow me to learn how to use DAX and custom background to bring your Power BI Dashboard to live. Download the dataset here: drive.google.com/file/d/1x04BcpMp0oV9RQ6eO08Lv1es0OVLQekU/view?usp=sharing Access the full Dashboard PBIX here: www.udemy.com/cours...

Be Creative with Power BI Dashboard | Creating a Drug Sales Dashboard Using Power BI Desktop
Просмотров 3,4 тыс.Месяц назад
Part-3. Power BI Desktop Essentials: Designing a Dashboard for Drug Sales Analysis. If crafting dynamic and interactive reports and dashboards using Power BI Desktop is on your learning list, this RUclips video is tailor-made for you. Don't forget to subscribe for more dashboards. Thank you. Download Custom Map here: github.com/topojson/world-atlas?tab=readme-ov-file Watch part-2 here: ruclips....

Be Creative with Power BI Dashboard | Creating a Drug Sales Dashboard Using Power BI Desktop
Просмотров 3,3 тыс.Месяц назад
Be Creative with Power BI Dashboard | Creating a Drug Sales Dashboard Using Power BI Desktop
Be Creative with Power BI Dashboard | Creating a Drug Sales Dashboard Using Power BI Desktop:
Просмотров 10 тыс.Месяц назад
Be Creative with Power BI Dashboard | Creating a Drug Sales Dashboard Using Power BI Desktop:

Interactive Insights: Excel Dashboard Techniques. How to Create Excel Dashboard YouTube Video
Просмотров 18 тыс.2 месяца назад
Interactive Insights: Excel Dashboard Techniques. How to Create Excel Dashboard RUclips Video
Interactive Insights: Excel Dashboard Techniques. How to create Excel Dashboard.
Просмотров 11 тыс.2 месяца назад
Interactive Insights: Excel Dashboard Techniques. How to create Excel Dashboard.
Interactive Insights: Excel Dashboard Techniques. How to create Excel Dashboard
Просмотров 117 тыс.2 месяца назад
Interactive Insights: Excel Dashboard Techniques. How to create Excel Dashboard
Advanced Microsoft Excel Dashboards with ChartGPT: Leveraging AI for Data Analytics (part-2)
Просмотров 3,7 тыс.3 месяца назад
Advanced Microsoft Excel Dashboards with ChartGPT: Leveraging AI for Data Analytics (part-2)
Advanced Microsoft Excel Dashboards with ChartGPT: Leveraging AI for Data Analytics
Просмотров 6 тыс.3 месяца назад
Advanced Microsoft Excel Dashboards with ChartGPT: Leveraging AI for Data Analytics
2024 Power BI Essentials: Crafting Cutting-Edge Transportation Reports
Просмотров 6 тыс.4 месяца назад
2024 Power BI Essentials: Crafting Cutting-Edge Transportation Reports
2024 Power BI Essentials: Crafting Cutting-Edge Transportation Reports
Просмотров 5 тыс.5 месяцев назад
2024 Power BI Essentials: Crafting Cutting-Edge Transportation Reports
2024 Power BI Essentials: Crafting Cutting-Edge Transportation Reports
Просмотров 4,3 тыс.5 месяцев назад
2024 Power BI Essentials: Crafting Cutting-Edge Transportation Reports
2024 Power BI Essentials: Crafting Cutting-Edge Transportation Reports
Просмотров 8 тыс.5 месяцев назад
2024 Power BI Essentials: Crafting Cutting-Edge Transportation Reports
Power BI Tutorial for you. Learn How to Analyze Crime Datasets Using Power Desktop | Understand DAX
Просмотров 6 тыс.5 месяцев назад
Power BI Tutorial for you. Learn How to Analyze Crime Datasets Using Power Desktop | Understand DAX
Power BI Tutorial for you. Learn How to Analyze Crime Datasets Using Power Desktop | Understand DAX
Просмотров 14 тыс.6 месяцев назад
Power BI Tutorial for you. Learn How to Analyze Crime Datasets Using Power Desktop | Understand DAX
Power BI Healthcare Analytic Dashboard | Hospital - Clinics Report. Create a Report in Power BI.
Просмотров 70 тыс.6 месяцев назад
Power BI Healthcare Analytic Dashboard | Hospital - Clinics Report. Create a Report in Power BI.
Power BI | Build Dynamic Report/Dashboard in Power BI Desktop
Просмотров 11 тыс.7 месяцев назад
Power BI | Build Dynamic Report/Dashboard in Power BI Desktop
Power BI | Build Dynamic Report/Dashboard in Power BI Desktop
Просмотров 9 тыс.7 месяцев назад
Power BI | Build Dynamic Report/Dashboard in Power BI Desktop
Power BI | Build Dynamic Report/Dashboard in Power BI Desktop
Просмотров 44 тыс.7 месяцев назад
Power BI | Build Dynamic Report/Dashboard in Power BI Desktop
The Microsoft Excel Dashboard Masterclass - Don't Miss It Part-4
Просмотров 12 тыс.8 месяцев назад
The Microsoft Excel Dashboard Masterclass - Don't Miss It Part-4
The Microsoft Excel Dashboard Masterclass - Don't Miss It Part-3
Просмотров 10 тыс.8 месяцев назад
The Microsoft Excel Dashboard Masterclass - Don't Miss It Part-3
The Microsoft Excel Dashboard Masterclass - Don't Miss It (Part-2)
Просмотров 19 тыс.8 месяцев назад
The Microsoft Excel Dashboard Masterclass - Don't Miss It (Part-2)
The Microsoft Excel Dashboard Masterclass - Don't Miss It Part-1
Просмотров 62 тыс.8 месяцев назад
The Microsoft Excel Dashboard Masterclass - Don't Miss It Part-1
Data Analyst's Blueprint: Creating a Portfolio That Lands Your Dream Job
Просмотров 3,6 тыс.9 месяцев назад
Data Analyst's Blueprint: Creating a Portfolio That Lands Your Dream Job
Designing Exceptional Power BI Dashboard with DAX Formula Mastery Part-2
Просмотров 4,6 тыс.9 месяцев назад
Designing Exceptional Power BI Dashboard with DAX Formula Mastery Part-2
Designing Exceptional Power BI Dashboard with DAX Formula Mastery Part-1
Просмотров 9 тыс.9 месяцев назад
Designing Exceptional Power BI Dashboard with DAX Formula Mastery Part-1
Thank you so much, learnt alot. But i had issues following up because the one drive address no longer works for the practise files. Thanks in advance
Will check it
Love this!
Thank you
Hey can you tell me how you make a hole in shape to see the drop list please
When is the next part gonna release for the further dashboard
All the parts are there
@@datalab365 Can u pls paste the link to the part-3 of these series
What is there in action and details tab...you havnt completed that part
Follow this series I will show you how I get it created: ruclips.net/video/hm4Iq2Mm2pQ/видео.html
Can you tell how created button on navigation tab
Please follow this series I will be sharing how I did it here. ruclips.net/video/hm4Iq2Mm2pQ/видео.html
How can we get the second screen? like the second page you created
Will be rolling out a new video on that soon.
@@datalab365 thank you
Great video! How did you remove the separator lines on the KPI card at the top?
I will show you in my next upload
Amazing... Thank you for sharing.
Thank you.
Date Format Error is happening when trying to convert Admission and Discharge Date type to Date , Cannot retrieve Date Values , Data values in the date coloumn in the raw files need to be cleaned
Change the region of the data form either UK to US the other way round. It depends on your location
Plz make vedio in simple English language.
I will thank you 🙏
hi if I am changing the data type in the visit file 50% data shows error can you tell me if should i proceed with this or what
Change the date to your region date format.
very nice, can you send to me data to traning
AM and PM don't appear in the column of date if you could help me in that pleas
Thank you very much for the beautiful work
Thank you too!
47:25 Isn't that Average Billing Amount per Patient, not per Visit?
Thank you so much. This was really insightful. I learnt a lot of new cool stuff. Thank you for all you do for the community. We appreciate you.
Thank you too. 🙏
Ad. Total Room Charge 1) Why do you created calculated column? They should be avoided, because they can slow the report refresh 2) To calculate Length of Stay +1 should be added to ensure that both the admission and discharge dates are included in the stay duration
Please listen to my explanations. I use the calculated column to show a row by row example which I did not use in the report. What I used was measure not calculated column.
@@datalab365 So why did you leave Length of Stay as a calculated column?
@@mrbartuss1😱 You can not create Length of stay as a measure because we need to use it for calculating total Room charges where you will have to use an iterator function to scan the table row by row. Please, show me how you can better create Total Room charges without the length of stay calculated column I add.
@@datalab365 Here it is: Total Room Charge = SUMX ( visits, VAR LengthOfStay = DATEDIFF ( visits[Admitted Date], visits[Discharge Date], DAY ) + 1 VAR DailyRate = visits[Room Charges(daily rate)] RETURN LengthOfStay * DailyRate )
@@datalab365 What about that? Total Room Charge = SUMX ( visits, VAR LengthOfStay = DATEDIFF ( visits[Admitted Date], visits[Discharge Date], DAY ) VAR DailyRate = visits[Room Charges(daily rate)] RETURN IF ( LengthOfStay > 0, ( LengthOfStay + 1 ) * DailyRate ) )
How did you calculate Average Room Charge please
Average Room Charge = DIVIDE( [Total Room Charges], [Total Patients] )
I have learned a lot from you and from this channel ❤... thank you and keep going.
Happy to hear that!
Wawo this exquisite how can I like it more that once🥰🥰🥰
I'm glad you like it
Liked before even watching. I already know it will be amazing. Thank you good sir.
You're the best!
This is beautiful
Thank you
I completed the entire dashboard end to end following it throughly.. Thank you so much "Data with Decisions". This is great video for any one trying to build a dashboard from scratch.
Thank you
Really Amazing
Thank you
Hi Mr.! I would like to translate this dashboard for Portuguese
Try Google translate but I don't know if there is a smoother way of doing it rather than copy and paste
Hi, I would like to see your fishtank :)
😭😂
Someone's stealing your works, and selling them as advertisement, mate! It's unethical!
Bro, do you do private tutorials?
Bro how do you do it, this is too consistent
go on bro ❤
Thank you.
You are truely a super hero , Mr. Omeiza !
👍🌹
I think for Date table CALENDAR is more useful than CALENDARAUTO( ). 👍
Man you are doing great job. Thank you.
Thank you
I will recreate this I have learned so much from u Thnaks
can someone help me out ..... for me in line chart (1.11.17) when i plot my month with the total patient , the line chart dosent form . it gives in x axis as blank . what can i do ?
Nice video . Can send me link of dashboard
please, when i filter the chart by the "top 5" or "Top 3", i usually get 6 or 4 . Please what could be the problem?
Some of the ''top 3' or 'top 5' figures will be the same, like 2 people having the same percentage in an examinamtion
Am i the only one facing problem in excel sheet ? #data_mismatch
do reply if anyone know the solution.
Good Job sir, Great Lecture, Simple question: GIF Picture not working fine with me I use excel 2016, is there any solution or I should use VBA to solve this ?
It works with Excel 2019 and beyond
Nice job, I've learnt a lot from you
Thank you.
It is a great project. Any it actually inspires ideas on things that can be further done with it.
Thank you
The data set you download doesn't match the dataset in your video. They are different. I don't know what data set you are actually using.
Kindly download from the description box of this video ruclips.net/video/y7VCIhxehg8/видео.html
Thank you for sharing this. I have been able to replicate this dashboard. Please can you create a dashboard that's fits in a construction industry. Thank you
Noted
no doubt there is so much to learn but Towards the ending you have made it so complex. what is the need of it.
😂😜
Nice...from india❤❤ Sir give some excel dashboard excercise for freee
Sure
while following p on the video, another way to resolve the quarter issue is to filter that particular visual by the quarter, and in ascending order. To do so; 1. go to that visual 2. click on the 'three dots' in the top left. 3. choose on 'sort axis', then 'quarter' 4. follow the first two process again, then choose 'ascending'
Surely